Harmonic Crab Pattern
The Crab is another harmonic pattern that is derived from the Gartley pattern. It was discovered by Scott Carney in 2000 and is known as one of the most powerful and accurate technical analysis chart patterns.
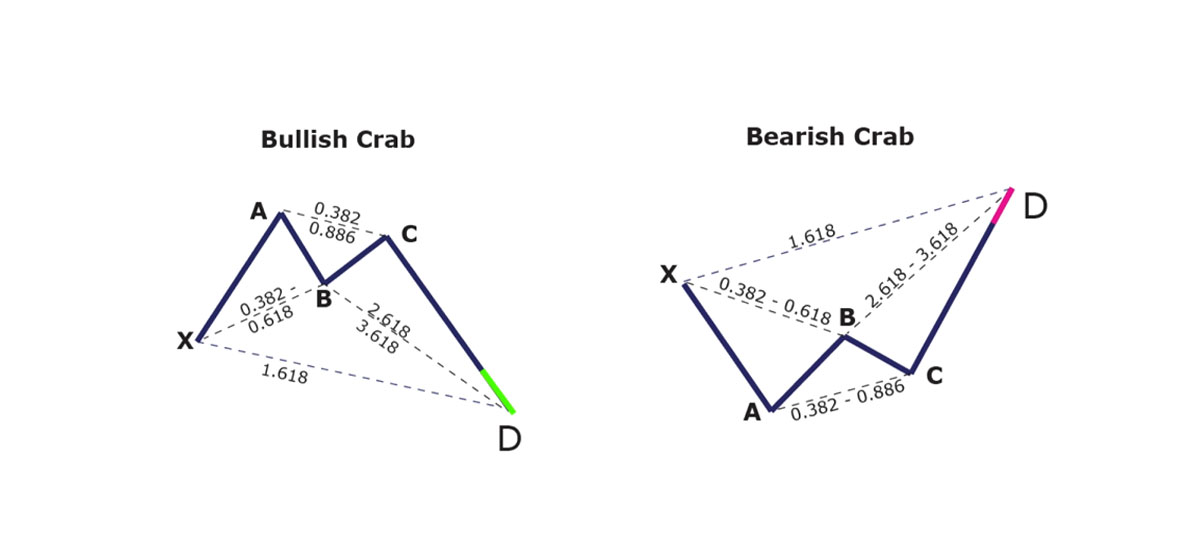
The Crab pattern is distinct due to its sharp movement in the CD leg. This is usually a 1.618% Fibonacci retracement of the XA leg.
The convergence of BC projection should serve as the minimum requirement for the pattern to be considered complete. The extreme projection of BC 3.14% (pi) considered as a perfect Crab’s Potential Reversal Zone (PRZ).
The crab pattern can be either bullish or bearish depending on its location on a price chart. Ultimately, when the pattern appears, it signals the end of the existing trend and the beginning of a new trend.